SimPEG.electromagnetics.static.utils.plot_3d_pseudosection#
- SimPEG.electromagnetics.static.utils.plot_3d_pseudosection(survey, dvec, marker_size=4, vlim=None, scale='linear', units='', plane_points=None, plane_distance=10.0, cbar_opts=None, marker_opts=None, layout_opts=None)[source]#
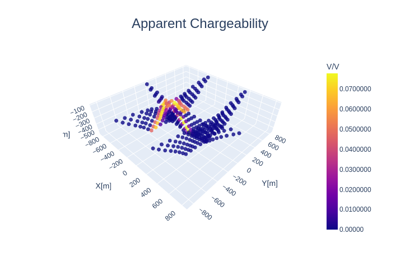
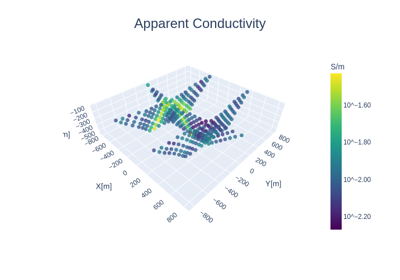
Plot 3D DC/IP data in pseudo-section as a scatter plot.
This utility allows the user to produce a scatter plot of 3D DC/IP data at all pseudo-locations. If a plane is specified, the user may create a scatter plot using points near that plane.
- Parameters:
- survey
SimPEG.electromagnetics.static.survey.Survey A DC or IP survey object
- dvec
numpy.ndarray A data vector containing volts, integrated chargeabilities, apparent resistivities or apparent chargeabilities.
- marker_size
int Sets the marker size for the points on the scatter plot
- vlim(2)
list list containing the minimum and maximum value for the color range, i.e. [vmin, vmax]
- scale{‘linear’, ‘log’}
Plot on linear or log base 10 scale.
- units
str A sting in d3 formatting the specified the units of dvec
- plane_points(3)
listofnumpy.ndarray A list of length 3 which contains the three xyz locations required to define a plane; i.e. [xyz1, xyz2, xyz3]. This functionality is used to plot only data that lie near this plane. A list of [xyz1, xyz2, xyz3] can be entered for multiple planes.
- plane_distance
floatorlistoffloat Distance tolerance for plotting data that are near the plane(s) defined by plane_points. A list is used if the plane_distance is different for each plane.
- cbar_opts: dict
Dictionary containing colorbar properties formatted according to plotly.graph_objects.scatter3d.cbar
- marker_opts
dict Dictionary containing marker properties formatted according to plotly.graph_objects.scatter3d
- layout_opts
dict Dictionary defining figure layout properties, formatted according to plotly.Layout
- survey
- Returns:
figA plotly figure