Note
Go to the end to download the full example code.
PF: Magnetics: Analytics#
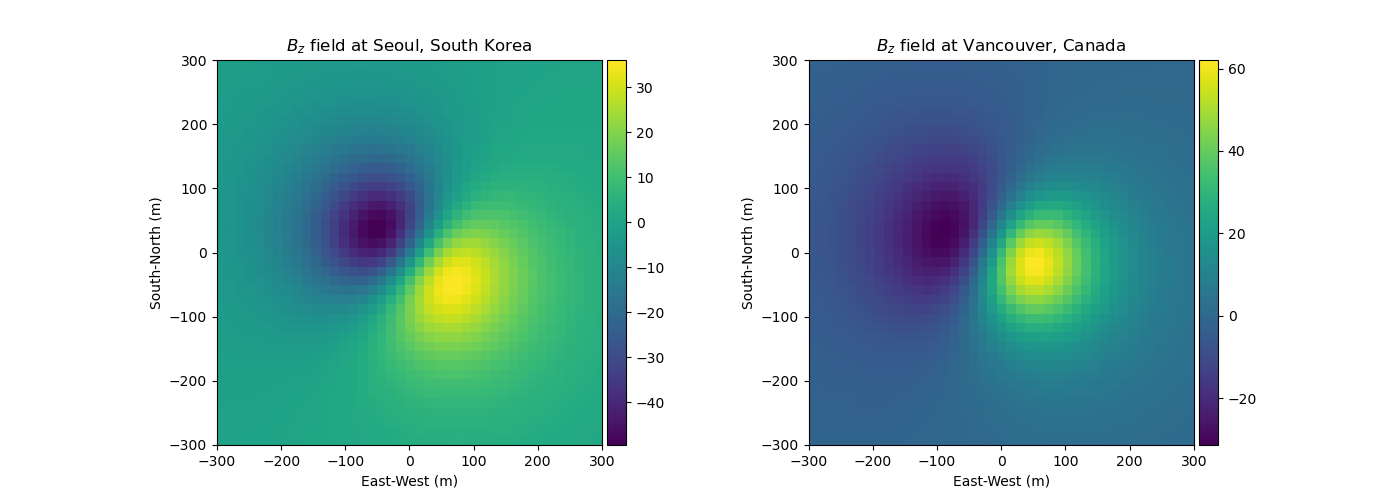
Comparing the magnetics field in Vancouver to Seoul

import numpy as np
from SimPEG.potential_fields.magnetics import analytics
import matplotlib.pyplot as plt
from mpl_toolkits.axes_grid1 import make_axes_locatable


def run(plotIt=True):
    xr = np.linspace(-300, 300, 41)
    yr = np.linspace(-300, 300, 41)
    X, Y = np.meshgrid(xr, yr)
    Z = np.ones((np.size(xr), np.size(yr))) * 150

    # Bz component in Korea
    inckr = -8.0 + 3.0 / 60
    deckr = 54.0 + 9.0 / 60
    btotkr = 50898.6
    Bokr = analytics.IDTtoxyz(inckr, deckr, btotkr)

    bx, by, bz = analytics.MagSphereAnaFunA(
        X, Y, Z, 100.0, 0.0, 0.0, 0.0, 0.01, Bokr, "secondary"
    )
    Bzkr = np.reshape(bz, (np.size(xr), np.size(yr)), order="F")

    # Bz component in Canada
    incca = 16.0 + 49.0 / 60
    decca = 70.0 + 19.0 / 60
    btotca = 54692.1
    Boca = analytics.IDTtoxyz(incca, decca, btotca)

    bx, by, bz = analytics.MagSphereAnaFunA(
        X, Y, Z, 100.0, 0.0, 0.0, 0.0, 0.01, Boca, "secondary"
    )
    Bzca = np.reshape(bz, (np.size(xr), np.size(yr)), order="F")

    if plotIt:
        plt.figure(figsize=(14, 5))

        ax1 = plt.subplot(121)
        dat1 = plt.imshow(Bzkr, extent=[min(xr), max(xr), min(yr), max(yr)])
        divider = make_axes_locatable(ax1)
        cax1 = divider.append_axes("right", size="5%", pad=0.05)
        ax1.set_xlabel("East-West (m)")
        ax1.set_ylabel("South-North (m)")
        plt.colorbar(dat1, cax=cax1)
        ax1.set_title("$B_z$ field at Seoul, South Korea")

        ax2 = plt.subplot(122)
        dat2 = plt.imshow(Bzca, extent=[min(xr), max(xr), min(yr), max(yr)])
        divider = make_axes_locatable(ax2)
        cax2 = divider.append_axes("right", size="5%", pad=0.05)
        ax2.set_xlabel("East-West (m)")
        ax2.set_ylabel("South-North (m)")
        plt.colorbar(dat2, cax=cax2)
        ax2.set_title("$B_z$ field at Vancouver, Canada")


if __name__ == "__main__":
    run()
    plt.show()
Total running time of the script: (0 minutes 0.608 seconds)
Estimated memory usage: 8 MB