Note
Go to the end to download the full example code.
TDEM: Waveforms#
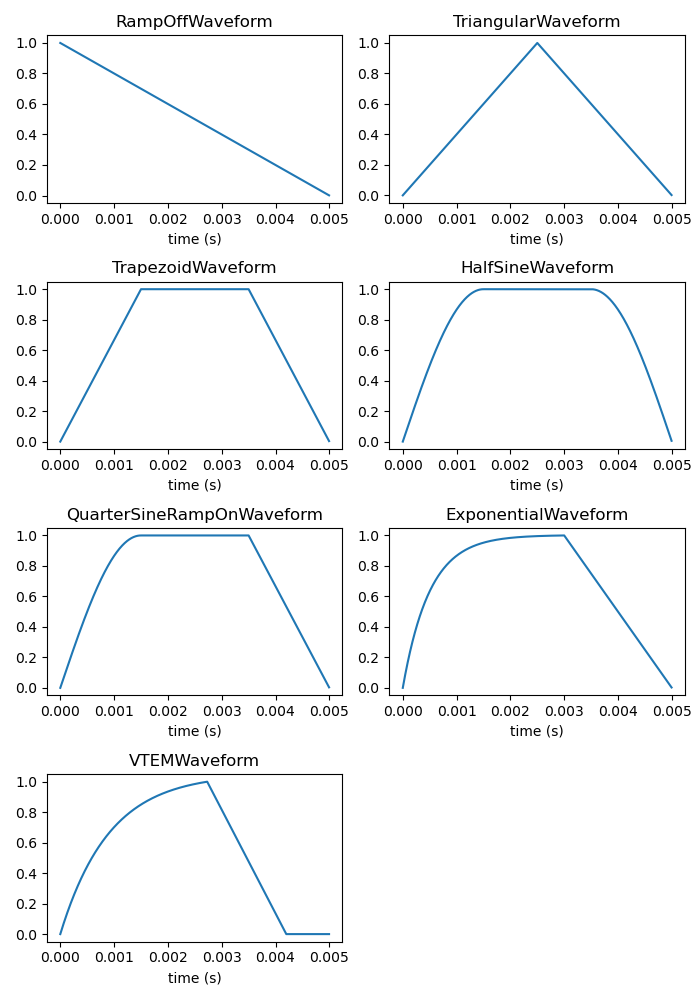
In this example, we plot the waveforms available in the TDEM module in addition to the StepOffWaveform

import matplotlib.pyplot as plt
import numpy as np
from simpeg.electromagnetics import time_domain as TDEM
from simpeg.utils import mkvc

nT = 1000
max_t = 5e-3
times = max_t * np.arange(0, nT) / float(nT)

# create the waveforms
ramp_off = TDEM.Src.RampOffWaveform(off_time=max_t)
vtem = TDEM.Src.VTEMWaveform()
trapezoid = TDEM.Src.TrapezoidWaveform(
    ramp_on=np.r_[0.0, 1.5e-3], ramp_off=max_t - np.r_[1.5e-3, 0]
)
triangular = TDEM.Src.TriangularWaveform(
    start_time=0.0, peak_time=max_t / 2, off_time=max_t
)
quarter_sine = TDEM.Src.QuarterSineRampOnWaveform(
    ramp_on=np.r_[0.0, 1.5e-3], ramp_off=max_t - np.r_[1.5e-3, 0]
)
half_sine = TDEM.Src.HalfSineWaveform(
    ramp_on=np.r_[0.0, 1.5e-3], ramp_off=max_t - np.r_[1.5e-3, 0]
)
exponential = TDEM.Src.ExponentialWaveform(
    start_time=0.0, peak_time=0.003, off_time=0.005, ramp_on_tau=5e-4
)

waveforms = dict(
    zip(
        [
            "RampOffWaveform",
            "TrapezoidWaveform",
            "QuarterSineRampOnWaveform",
            "VTEMWaveform",
            "TriangularWaveform",
            "HalfSineWaveform",
            "ExponentialWaveform",
        ],
        [ramp_off, trapezoid, quarter_sine, vtem, triangular, half_sine, exponential],
    )
)

# plot the waveforms
fig, ax = plt.subplots(4, 2, figsize=(7, 10))
ax = mkvc(ax)

for a, key in zip(ax, waveforms):
    wave = waveforms[key]
    wave_plt = [wave.eval(t) for t in times]
    a.plot(times, wave_plt)
    a.set_title(key)
    a.set_xlabel("time (s)")
# deactivate last subplot as it is empty
ax[-1].axis("off")
plt.tight_layout()
plt.show()
Total running time of the script: (0 minutes 1.066 seconds)
Estimated memory usage: 163 MB