simpeg.utils.plot2Ddata#
- simpeg.utils.plot2Ddata(xyz, data, vec=False, nx=100, ny=100, ax=None, mask=None, level=False, figname=None, ncontour=10, dataloc=False, contourOpts=None, levelOpts=None, streamplotOpts=None, scale='linear', clim=None, method='linear', shade=False, shade_ncontour=100, shade_azimuth=-45.0, shade_angle_altitude=45.0, shadeOpts=None)[source]#
Interpolate and plot unstructured 2D data.
General plotting for scalar and vector quantities as a function of their x and y locations. plot2Ddata uses interpolates the unstructured data to a specified set of gridded locations before plotting with
matplotlib.pyplot.contourf(). For vectors,matplotlib.pyplot.streamplot()is used to add a stream plot. As this function produces a plot for 2D data, the vertical position and vertical vector component (in the case of a vector) is ignored.- Parameters:
- xyz
numpy.ndarray Data locations [x,y(,z)]. If the data locations are defined in 3D, the z-column is ignored.
- data
numpy.ndarray Data values. For scalar quantities, the data are stored in a 1D
numpy.ndarray. For vector quantities, data are stored in a numpy array of shape (N, dim).- vecbool
If
True, the data values represent a vector quantity and the function creates a stream plot illustrating the x and y components of the vector.- nx
int Number of grid locations along x-direction
- ny
int Number of grid locations along y-direction
- ax
matplotlib.axes An axes object on which to plot. If
None, the function creates an axes object- mask
numpy.ndarrayofbool Locations in the unstructured grid whose data are masked.
- levelbool
If
True, adds contours according tomatplotlib.pyplot.contour()- figname
str Figure name
- ncontour
int number of contours in the contour plot
- datalocbool
If
True, plot the data locations- contourOpts
dict Dictionary defining keyword arguments when
matplotlib.pyplot.contourf()is called- levelOpts
dict Dictionary defining keyword arguments when
matplotlib.pyplot.contourf()is called. This is only necessary when level =True.- clim(2)
numpy.ndarray Colorbar limits
- method
str Interpolation method used to approximate at gridded locations. Must be ‘linear’ or ‘nearest’
- shadebool
If
True, add shading to the plot- shade_ncontour
int Number of
matplotlib.pyplot.contourf()contours for the shading- shade_azimuth
float Azimuthal angle for the light source if shading
- shade_angle_altitude
float Altitude angle for the light source if shading
- xyz
- Returns:
- cont
matplotlib.contour.ContourSet The filled contour plot
- ax
matplotlib.axes The axes object for the plot.
- CS
matplotlib.contour.ContourSet If the input parameter levels is
True, the function outputs the level set for the contours
- cont
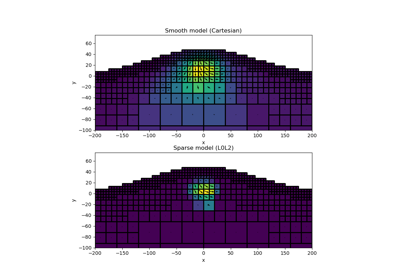
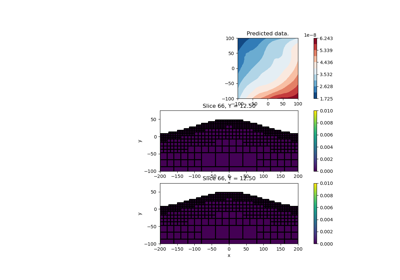
Galleries and Tutorials using simpeg.utils.plot2Ddata#
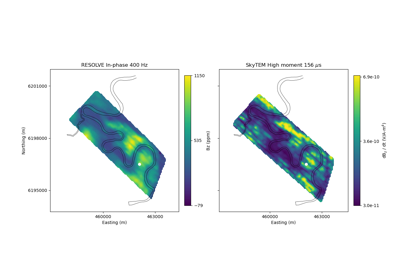
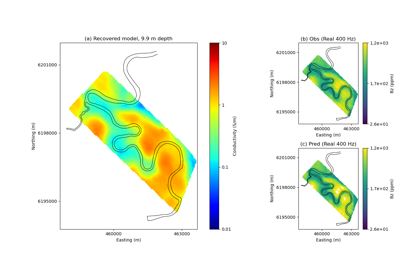
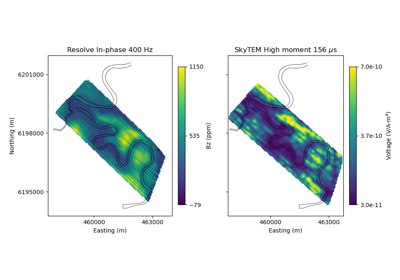
Heagy et al., 2017 1D RESOLVE and SkyTEM Bookpurnong Inversions
Heagy et al., 2017 1D RESOLVE Bookpurnong Inversion
Cross-gradient Joint Inversion of Gravity and Magnetic Anomaly Data

Joint PGI of Gravity + Magnetic on an Octree mesh using full petrophysical information

Joint PGI of Gravity + Magnetic on an Octree mesh without petrophysical information