Note
Click here to download the full example code
PF: Gravity: Laguna del Maule Bouguer Gravity#
This notebook illustrates the SimPEG code used to invert Bouguer gravity data collected at Laguna del Maule volcanic field, Chile. Refer to Miller et al 2016 EPSL for full details.
We run the inversion in two steps. Firstly creating a L2 model and then applying an Lp norm to produce a compact model.
Craig Miller
Downloading https://storage.googleapis.com/simpeg/Chile_GRAV_4_Miller/Chile_GRAV_4_Miller.tar.gz
   saved to: /home/vsts/work/1/s/examples/20-published/Chile_GRAV_4_Miller.tar.gz
Download completed!

                    SimPEG.InvProblem is setting bfgsH0 to the inverse of the eval2Deriv.
                    ***Done using the default solver Pardiso and no solver_opts.***

model has any nan: 0
=============================== Projected GNCG ===============================
  #     beta     phi_d     phi_m       f      |proj(x-g)-x|  LS    Comment
-----------------------------------------------------------------------------
x0 has any nan: 0
   0  8.82e-04  1.30e+06  9.44e+01  1.30e+06    1.95e+02      0
   1  4.41e-04  5.22e+03  5.28e+07  2.85e+04    1.32e+02      0
   2  2.21e-04  1.95e+03  5.78e+07  1.47e+04    1.21e+02      0   Skip BFGS
   3  1.10e-04  6.92e+02  6.17e+07  7.50e+03    1.05e+02      0   Skip BFGS
   4  5.51e-05  2.32e+02  6.45e+07  3.79e+03    8.48e+01      0   Skip BFGS
Reached starting chifact with l2-norm regularization: Start IRLS steps...
irls_threshold 0.3500895177476927
   5  2.76e-05  7.46e+01  1.35e+08  3.79e+03    5.83e+01      0   Skip BFGS
   6  2.76e-05  7.98e+01  1.83e+08  5.12e+03    1.07e+02      0
   7  1.90e-05  1.52e+02  2.36e+08  4.64e+03    6.80e+01      0
   8  1.19e-05  1.90e+02  2.23e+08  2.84e+03    1.80e+02      1
   9  7.51e-06  1.87e+02  1.86e+08  1.59e+03    1.93e+02      0   Skip BFGS
  10  1.79e-05  3.44e+01  1.51e+08  2.74e+03    1.15e+02      0
  11  1.79e-05  1.09e+02  1.15e+08  2.17e+03    1.01e+02      0
  12  1.79e-05  1.00e+02  8.78e+07  1.68e+03    1.03e+02      0
  13  1.79e-05  9.19e+01  6.99e+07  1.35e+03    8.95e+01      0
  14  1.79e-05  7.98e+01  6.03e+07  1.16e+03    1.35e+02      0
  15  1.79e-05  6.95e+01  5.11e+07  9.86e+02    6.56e+01      0
  16  1.79e-05  5.81e+01  4.21e+07  8.14e+02    7.44e+01      0   Skip BFGS
  17  3.64e-05  4.64e+01  3.97e+07  1.49e+03    1.35e+02      0   Skip BFGS
  18  3.64e-05  9.43e+01  3.34e+07  1.31e+03    7.86e+01      0
  19  3.64e-05  8.94e+01  3.03e+07  1.19e+03    7.49e+01      0   Skip BFGS
  20  3.64e-05  7.89e+01  2.91e+07  1.14e+03    7.61e+01      0   Skip BFGS
------------------------- STOP! -------------------------
1 : |fc-fOld| = 5.1775e+01 <= tolF*(1+|f0|) = 1.3018e+05
0 : |xc-x_last| = 9.6394e-01 <= tolX*(1+|x0|) = 1.0400e-01
0 : |proj(x-g)-x|    = 7.6095e+01 <= tolG          = 1.0000e-01
0 : |proj(x-g)-x|    = 7.6095e+01 <= 1e3*eps       = 1.0000e-02
1 : maxIter   =      20    <= iter          =     20
------------------------- DONE! -------------------------
import os
import shutil
import tarfile
from SimPEG.potential_fields import gravity
from SimPEG import (
    data,
    data_misfit,
    maps,
    regularization,
    optimization,
    inverse_problem,
    directives,
    inversion,
)
from SimPEG import utils
from SimPEG.utils import download, plot2Ddata

import matplotlib.pyplot as plt
import numpy as np
from SimPEG.utils.drivers.gravity_driver import GravityDriver_Inv


def run(plotIt=True, cleanAfterRun=True):

    # Start by downloading files from the remote repository
    # directory where the downloaded files are

    url = "https://storage.googleapis.com/simpeg/Chile_GRAV_4_Miller/Chile_GRAV_4_Miller.tar.gz"
    downloads = download(url, overwrite=True)
    basePath = downloads.split(".")[0]

    # unzip the tarfile
    tar = tarfile.open(downloads, "r")
    tar.extractall()
    tar.close()

    input_file = basePath + os.path.sep + "LdM_input_file.inp"
    # %% User input
    # Plotting parameters, max and min densities in g/cc
    vmin = -0.6
    vmax = 0.6

    # weight exponent for default weighting
    wgtexp = 3.0
    # %%
    # Read in the input file which included all parameters at once
    # (mesh, topo, model, survey, inv param, etc.)
    driver = GravityDriver_Inv(input_file)
    # %%
    # Now we need to create the survey and model information.

    # Access the mesh and survey information
    mesh = driver.mesh  #
    survey = driver.survey
    data_object = driver.data
    # [survey, data_object] = driver.survey

    # define gravity survey locations
    rxLoc = survey.source_field.receiver_list[0].locations

    # define gravity data and errors
    d = data_object.dobs

    # Get the active cells
    active = driver.activeCells
    nC = int(active.sum())  # Number of active cells

    # Create active map to go from reduce set to full
    activeMap = maps.InjectActiveCells(mesh, active, -100)

    # Create static map
    static = driver.staticCells
    dynamic = driver.dynamicCells

    staticCells = maps.InjectActiveCells(None, dynamic, driver.m0[static], nC=nC)
    mstart = driver.m0[dynamic]

    # Get index of the center
    midx = int(mesh.shape_cells[0] / 2)
    # %%
    # Now that we have a model and a survey we can build the linear system ...
    # Create the forward model operator
    simulation = gravity.simulation.Simulation3DIntegral(
        survey=survey, mesh=mesh, rhoMap=staticCells, ind_active=active
    )

    # %% Create inversion objects
    reg = regularization.Sparse(
        mesh, active_cells=active, mapping=staticCells, gradientType="total"
    )
    reg.mref = driver.mref[dynamic]

    reg.norms = [0.0, 1.0, 1.0, 1.0]
    # reg.norms = driver.lpnorms

    # Specify how the optimization will proceed
    opt = optimization.ProjectedGNCG(
        maxIter=20,
        lower=driver.bounds[0],
        upper=driver.bounds[1],
        maxIterLS=10,
        maxIterCG=20,
        tolCG=1e-4,
    )

    # Define misfit function (obs-calc)
    dmis = data_misfit.L2DataMisfit(data=data_object, simulation=simulation)

    # create the default L2 inverse problem from the above objects
    invProb = inverse_problem.BaseInvProblem(dmis, reg, opt)

    # Specify how the initial beta is found
    betaest = directives.BetaEstimate_ByEig(beta0_ratio=0.5, seed=518936)

    # IRLS sets up the Lp inversion problem
    # Set the eps parameter parameter in Line 11 of the
    # input file based on the distribution of model (DEFAULT = 95th %ile)
    IRLS = directives.Update_IRLS(
        f_min_change=1e-4, max_irls_iterations=40, coolEpsFact=1.5, beta_tol=5e-1
    )

    # Preconditioning refreshing for each IRLS iteration
    update_Jacobi = directives.UpdatePreconditioner()
    sensitivity_weights = directives.UpdateSensitivityWeights()

    # Create combined the L2 and Lp problem
    inv = inversion.BaseInversion(
        invProb, directiveList=[sensitivity_weights, IRLS, update_Jacobi, betaest]
    )

    # %%
    # Run L2 and Lp inversion
    mrec = inv.run(mstart)

    if cleanAfterRun:
        os.remove(downloads)
        shutil.rmtree(basePath)

    # %%
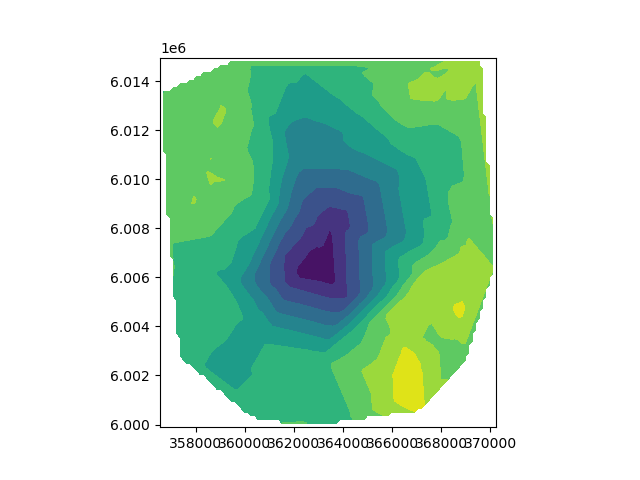
    if plotIt:
        # Plot observed data
        # The sign of the data is flipped here for the change of convention
        # between Cartesian coordinate system (internal SimPEG format that
        # expects "positive up" gravity signal) and traditional gravity data
        # conventions (positive down). For example a traditional negative
        # gravity anomaly is described as "positive up" in Cartesian coordinates
        # and hence the sign needs to be flipped for use in SimPEG.
        plot2Ddata(rxLoc, -d)

        # %%
        # Write output model and data files and print misfit stats.

        # reconstructing l2 model mesh with air cells and active dynamic cells
        L2out = activeMap * invProb.l2model

        # reconstructing lp model mesh with air cells and active dynamic cells
        Lpout = activeMap * mrec

        # %%
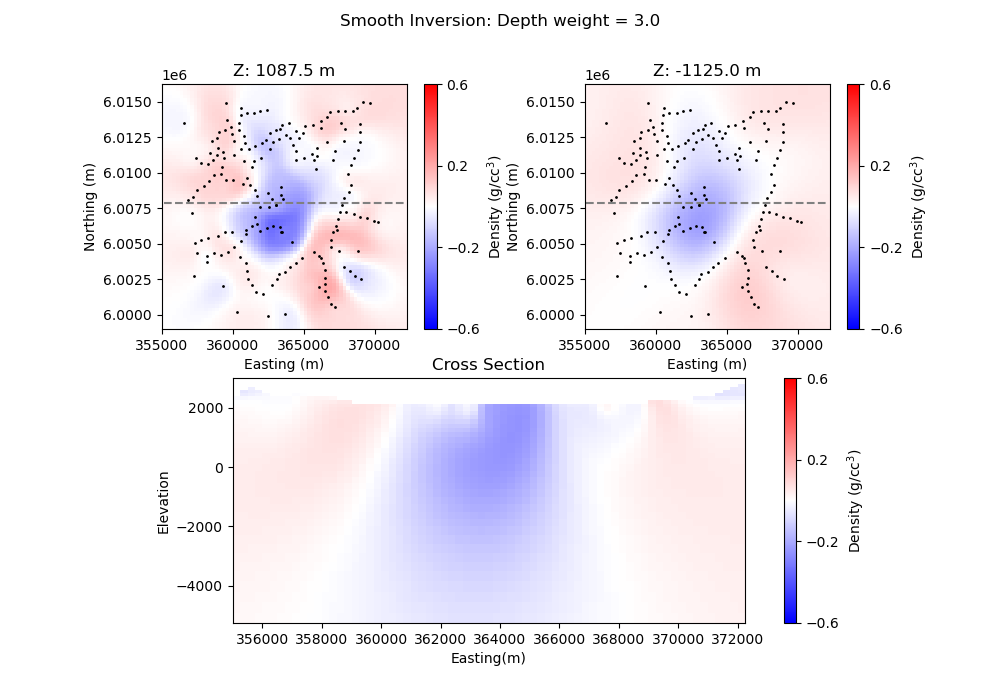
        # Plot out sections and histograms of the smooth l2 model.
        # The ind= parameter is the slice of the model from top down.
        yslice = midx + 1
        L2out[L2out == -100] = np.nan  # set "air" to nan

        plt.figure(figsize=(10, 7))
        plt.suptitle("Smooth Inversion: Depth weight = " + str(wgtexp))
        ax = plt.subplot(221)
        dat1 = mesh.plot_slice(
            L2out,
            ax=ax,
            normal="Z",
            ind=-16,
            clim=(vmin, vmax),
            pcolor_opts={"cmap": "bwr"},
        )
        plt.plot(
            np.array([mesh.cell_centers_x[0], mesh.cell_centers_x[-1]]),
            np.array([mesh.cell_centers_y[yslice], mesh.cell_centers_y[yslice]]),
            c="gray",
            linestyle="--",
        )
        plt.scatter(rxLoc[0:, 0], rxLoc[0:, 1], color="k", s=1)
        plt.title("Z: " + str(mesh.cell_centers_z[-16]) + " m")
        plt.xlabel("Easting (m)")
        plt.ylabel("Northing (m)")
        plt.gca().set_aspect("equal", adjustable="box")
        cb = plt.colorbar(
            dat1[0], orientation="vertical", ticks=np.linspace(vmin, vmax, 4)
        )
        cb.set_label("Density (g/cc$^3$)")

        ax = plt.subplot(222)
        dat = mesh.plot_slice(
            L2out,
            ax=ax,
            normal="Z",
            ind=-27,
            clim=(vmin, vmax),
            pcolor_opts={"cmap": "bwr"},
        )
        plt.plot(
            np.array([mesh.cell_centers_x[0], mesh.cell_centers_x[-1]]),
            np.array([mesh.cell_centers_y[yslice], mesh.cell_centers_y[yslice]]),
            c="gray",
            linestyle="--",
        )
        plt.scatter(rxLoc[0:, 0], rxLoc[0:, 1], color="k", s=1)
        plt.title("Z: " + str(mesh.cell_centers_z[-27]) + " m")
        plt.xlabel("Easting (m)")
        plt.ylabel("Northing (m)")
        plt.gca().set_aspect("equal", adjustable="box")
        cb = plt.colorbar(
            dat1[0], ax=ax, orientation="vertical", ticks=np.linspace(vmin, vmax, 4)
        )
        cb.set_label("Density (g/cc$^3$)")

        ax = plt.subplot(212)
        mesh.plot_slice(
            L2out,
            ax=ax,
            normal="Y",
            ind=yslice,
            clim=(vmin, vmax),
            pcolor_opts={"cmap": "bwr"},
        )
        plt.title("Cross Section")
        plt.xlabel("Easting(m)")
        plt.ylabel("Elevation")
        plt.gca().set_aspect("equal", adjustable="box")
        cb = plt.colorbar(
            dat1[0],
            ax=ax,
            orientation="vertical",
            ticks=np.linspace(vmin, vmax, 4),
            cmap="bwr",
        )
        cb.set_label("Density (g/cc$^3$)")

        # %%
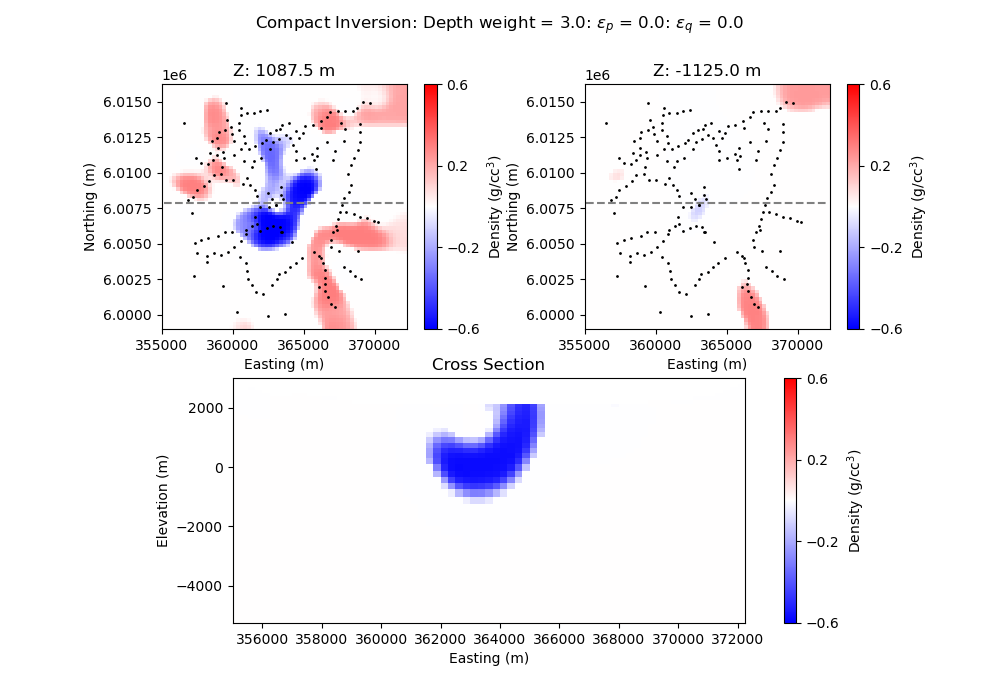
        # Make plots of Lp model
        yslice = midx + 1
        Lpout[Lpout == -100] = np.nan  # set "air" to nan

        plt.figure(figsize=(10, 7))
        plt.suptitle(
            "Compact Inversion: Depth weight = "
            + str(wgtexp)
            + ": $\epsilon_p$ = "
            + str(round(reg.objfcts[0].irls_threshold, 1))
            + ": $\epsilon_q$ = "
            + str(round(reg.objfcts[1].irls_threshold, 2))
        )
        ax = plt.subplot(221)
        dat = mesh.plot_slice(
            Lpout,
            ax=ax,
            normal="Z",
            ind=-16,
            clim=(vmin, vmax),
            pcolor_opts={"cmap": "bwr"},
        )
        plt.plot(
            np.array([mesh.cell_centers_x[0], mesh.cell_centers_x[-1]]),
            np.array([mesh.cell_centers_y[yslice], mesh.cell_centers_y[yslice]]),
            c="gray",
            linestyle="--",
        )
        plt.scatter(rxLoc[0:, 0], rxLoc[0:, 1], color="k", s=1)
        plt.title("Z: " + str(mesh.cell_centers_z[-16]) + " m")
        plt.xlabel("Easting (m)")
        plt.ylabel("Northing (m)")
        plt.gca().set_aspect("equal", adjustable="box")
        cb = plt.colorbar(
            dat[0], ax=ax, orientation="vertical", ticks=np.linspace(vmin, vmax, 4)
        )
        cb.set_label("Density (g/cc$^3$)")

        ax = plt.subplot(222)
        dat = mesh.plot_slice(
            Lpout,
            ax=ax,
            normal="Z",
            ind=-27,
            clim=(vmin, vmax),
            pcolor_opts={"cmap": "bwr"},
        )
        plt.plot(
            np.array([mesh.cell_centers_x[0], mesh.cell_centers_x[-1]]),
            np.array([mesh.cell_centers_y[yslice], mesh.cell_centers_y[yslice]]),
            c="gray",
            linestyle="--",
        )
        plt.scatter(rxLoc[0:, 0], rxLoc[0:, 1], color="k", s=1)
        plt.title("Z: " + str(mesh.cell_centers_z[-27]) + " m")
        plt.xlabel("Easting (m)")
        plt.ylabel("Northing (m)")
        plt.gca().set_aspect("equal", adjustable="box")
        cb = plt.colorbar(
            dat[0], ax=ax, orientation="vertical", ticks=np.linspace(vmin, vmax, 4)
        )
        cb.set_label("Density (g/cc$^3$)")

        ax = plt.subplot(212)
        dat = mesh.plot_slice(
            Lpout,
            ax=ax,
            normal="Y",
            ind=yslice,
            clim=(vmin, vmax),
            pcolor_opts={"cmap": "bwr"},
        )
        plt.title("Cross Section")
        plt.xlabel("Easting (m)")
        plt.ylabel("Elevation (m)")
        plt.gca().set_aspect("equal", adjustable="box")
        cb = plt.colorbar(
            dat[0], ax=ax, orientation="vertical", ticks=np.linspace(vmin, vmax, 4)
        )
        cb.set_label("Density (g/cc$^3$)")


if __name__ == "__main__":
    run()
    plt.show()
Total running time of the script: ( 1 minutes 3.859 seconds)
Estimated memory usage: 568 MB


