SimPEG.utils.plot2Ddata#
- SimPEG.utils.plot2Ddata(xyz, data, vec=False, nx=100, ny=100, ax=None, mask=None, level=False, figname=None, ncontour=10, dataloc=False, contourOpts={}, levelOpts={}, streamplotOpts={}, scale='linear', clim=None, method='linear', shade=False, shade_ncontour=100, shade_azimuth=- 45.0, shade_angle_altitude=45.0, shadeOpts={})[source]#
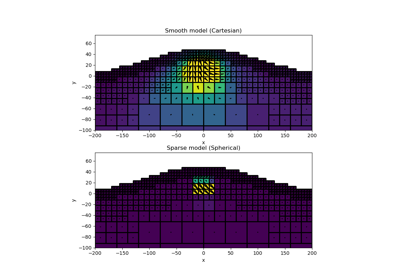
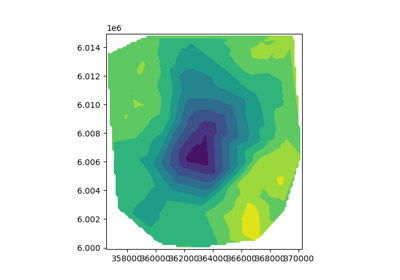
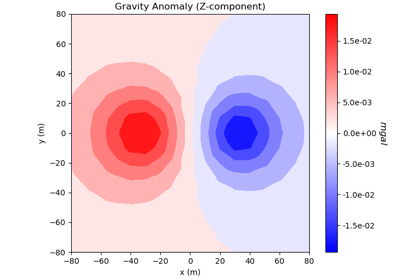
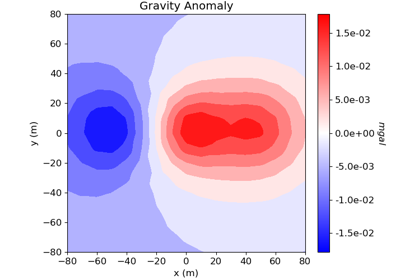
Interpolate and plot unstructured 2D data.
General plotting for scalar and vector quantities as a function of their x and y locations. plot2Ddata uses interpolates the unstructured data to a specified set of gridded locations before plotting with
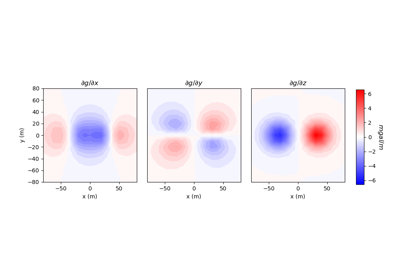
matplotlib.pyplot.contourf(). For vectors,matplotlib.pyplot.streamplot()is used to add a stream plot. As this function produces a plot for 2D data, the vertical position and vertical vector component (in the case of a vector) is ignored.- Parameters
- xyz
numpy.ndarray Data locations [x,y(,z)]. If the data locations are defined in 3D, the z-column is ignored.
- data
numpy.ndarray Data values. For scalar quantities, the data are stored in a 1D
numpy.ndarray. For vector quantities, data are stored in a numpy array of shape (N, dim).- vecbool
If
True, the data values represent a vector quantity and the function creates a stream plot illustrating the x and y components of the vector.- nx
int Number of grid locations along x-direction
- ny
int Number of grid locations along y-direction
- ax
matplotlib.axes An axes object on which to plot. If
None, the function creates an axes object- mask
numpy.ndarrayofbool Locations in the unstructured grid whose data are masked.
- levelbool
If
True, adds contours according tomatplotlib.pyplot.contour()- figname
str Figure name
- ncontour
int number of contours in the contour plot
- datalocbool
If
True, plot the data locations- contourOpts
dict Dictionary defining keyword arguments when
matplotlib.pyplot.contourf()is called- levelOpts
dict Dictionary defining keyword arguments when
matplotlib.pyplot.contourf()is called. This is only necessary when level =True.- clim(2)
numpy.ndarray Colorbar limits
- method
str Interpolation method used to approximate at gridded locations. Must be ‘linear’ or ‘nearest’
- shadebool
If
True, add shading to the plot- shade_ncontour
int Number of
matplotlib.pyplot.contourf()contours for the shading- shade_azimuth
float Azimuthal angle for the light source if shading
- shade_angle_altitude
float Altitude angle for the light source if shading
- xyz
- Returns
- cont
matplotlib.contour.ContourSet The filled contour plot
- ax
matplotlib.axes The axes object for the plot.
- CS
matplotlib.contour.ContourSet If the input parameter levels is
True, the function outputs the level set for the contours
- cont
Galleries and Tutorials using SimPEG.utils.plot2Ddata#
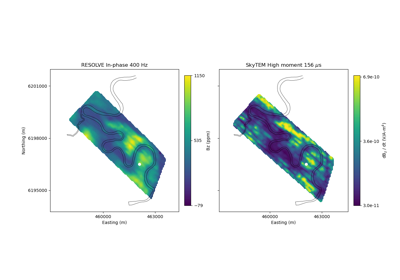
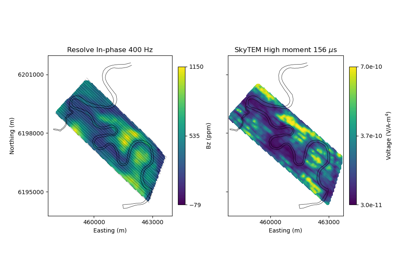
Heagy et al., 2017 1D RESOLVE and SkyTEM Bookpurnong Inversions
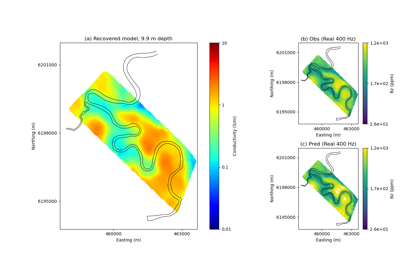
Heagy et al., 2017 1D RESOLVE Bookpurnong Inversion
Forward Simulation of Gravity Anomaly Data on a Tensor Mesh
Forward Simulation of Gradiometry Data on a Tree Mesh

Joint PGI of Gravity + Magnetic on an Octree mesh using full petrophysical information

Joint PGI of Gravity + Magnetic on an Octree mesh without petrophysical information
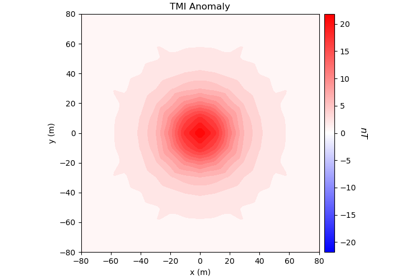
Forward Simulation of Total Magnetic Intensity Data
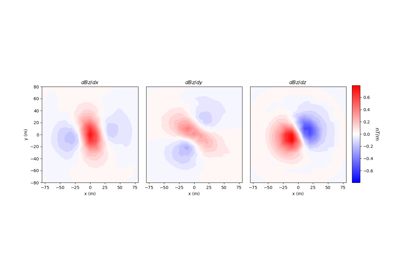
Forward Simulation of Gradiometry Data for Magnetic Vector Models
Sparse Norm Inversion for Total Magnetic Intensity Data on a Tensor Mesh
Cross-gradient Joint Inversion of Gravity and Magnetic Anomaly Data