SimPEG.electromagnetics.static.utils.plot_pseudosection#
- SimPEG.electromagnetics.static.utils.plot_pseudosection(data, dobs=None, plot_type='contourf', ax=None, clim=None, scale='linear', pcolor_opts=None, contourf_opts=None, scatter_opts=None, mask_topography=False, create_colorbar=True, cbar_opts=None, cbar_label='', cax=None, data_locations=False, data_type=None, space_type='half space', **kwargs)[source]#
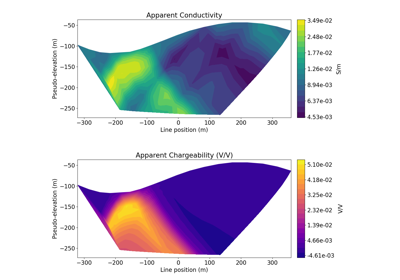
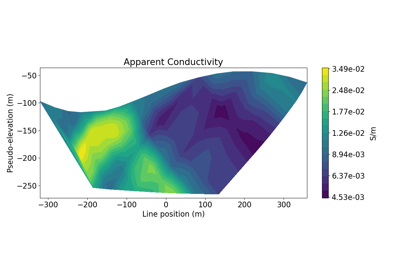
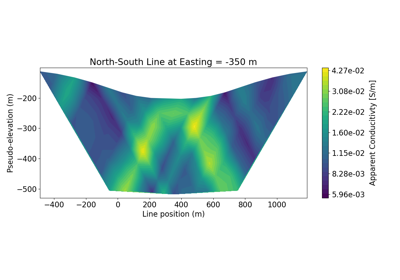
Plot 2D DC/IP data in pseudo-section.
This utility allows the user to image 2D DC/IP data in pseudosection as either a scatter plot or as a filled contour plot.
- Parameters
- data
SimPEG.electromagnetics.static.survey.SurveyorSimPEG.data.Data A DC or IP survey object defining a 2D survey line, or a Data object containing that same type of survey object.
- dobs
numpy.ndarray(ndata,)orNone A data vector containing volts, integrated chargeabilities, apparent resistivities, apparent chargeabilities or data misfits.
- plot_type{“contourf”, “scatter”, “pcolor”}
Which plot type to create.
- ax
mpl_toolkits.mplot3d.axes.Axes,optional An axis for the plot
- clim(2)
list,optional list containing the minimum and maximum value for the color range, i.e. [vmin, vmax]
- scale{‘linear’, ‘log’}
Plot on linear or log base 10 scale.
- pcolor_opts
dict,optional Dictionary defining kwargs for pcolor plot if plot_type==’pcolor’
- contourf_opts
dict,optional Dictionary defining kwargs for filled contour plot if plot_type==’contourf’
- scatter_opts
dict,optional Dictionary defining kwargs for scatter plot if plot_type==’scatter’
- mask_topographybool
This freature should be set to True when there is significant topography and the user would like to mask interpolated locations in the filled contour plot that lie above the surface topography.
- create_colorbarbool
If True, a colorbar is automatically generated. If False, it is not. If multiple planes are being plotted, only set the first scatter plot to True
- cbar_opts
dict Dictionary defining kwargs for the colorbar
- cbar_label
str A string stating the color bar label for the data; e.g. ‘S/m’, ‘$Omega m$’, ‘%’
- cax
mpl_toolkits.mplot3d.axes.Axes,optional An axis object for the colorbar
- data_type
str,optional If dobs is
None, this will transform the data vector in the survey parameter when it is a SimPEG.data.Data object from voltage to the requested data_type. This occurs when dobs is None. You may also use “apparent_conductivity” or “apparent_resistivity” to define the data type.- space_type{‘half space’, “whole space”}
Space type to used for the transformation from voltage to data_type if dobs is
None.
- data
- Returns
mpl_toolkits.mplot3d.axes3d.Axes3DThe axis object that holds the plot
Galleries and Tutorials using SimPEG.electromagnetics.static.utils.plot_pseudosection#
2.5D DC Resistivity and IP Least-Squares Inversion
